

Editor’s note: Opinions expressed in this letter to the editor are those of the author alone and may not reflect the editorial position of ClarkCountyToday.com
TriMet’s MAX light rail system has a long history of dramatically over-predicting ridership. Low and declining MAX usage has helped to fuel TriMet’s massive budget deficits leading to ongoing cuts in service. The Interstate Bridge Replacement Program (IBR) uses similar models to predict enormous (~20x) increases in future transit ridership to justify spending an estimated $3.5 billion for bringing Oregon light rail across the I-5 Bridge into Vancouver. Here are some details about MAX light rail’s history of poor predictions.
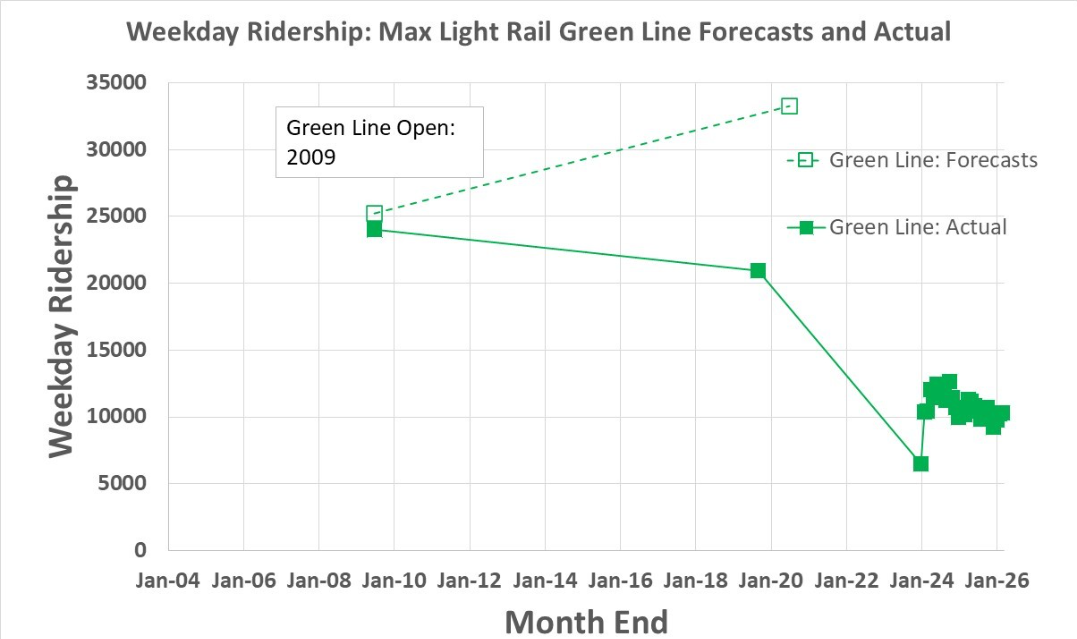
At the October 14, 2025 C-TRAN board meeting, IBR executives were asked about forecasted vs. actual ridership results for the MAX light rail system. The IBR program administrator replied in a letter dated December 10, 2025. He discussed only the MAX Green Line and Orange Line, and just gave information about the opening year ridership, saying nothing about ridership since then. It has been very low. For 2024-2026 these two lines are at about one third of forecasts.
- MAX Green Line: Ridership forecasts for the 2009 opening year were made with the Oregon Metro Regional Travel Demand Model (RTDM). (The letter cites a FY 2014 Report to Congress.)
- 2009 TriMet Forecast: 25,250 average weekday riders
- 2009 Actual: 24,000
That’s good for the first year (2009), but what about since then? Since the IBR letter gave no information, I found other sources. (Data for all the graphs below: Cascade Policy Institute 2020 Letter to FTA, TriMet Light Rail Monthly Performance Reports)
- 2020 Forecast: ~33,270 average weekday riders
- 2019 Actual (pre-COVID): ~20,940 (~63% of 2020 forecast)
- 2024-2026 Actual: ~10,000 – 11,000 (less than 33% of 2020 forecast)
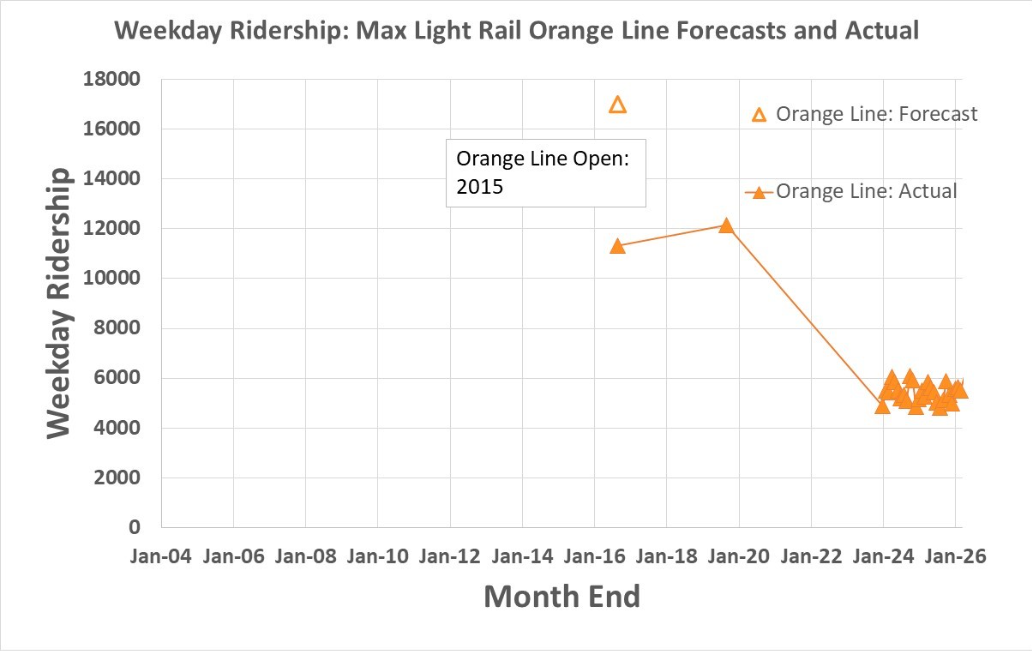
In the same Dec 10, 2025 letter, IBR admitted that the MAX Orange Line ridership forecast for the 2015 opening year was quite a bit higher than actual:
- 2015 Predicted: 17,000
- 2016 Actual: 11,300 (~67% of 2015 forecast)
IBR claimed that, after adjusting the model, they got it closer to the actual numbers. However, since funding depends on predictions made some years in advance, that is a poor excuse.
What about more recent ridership?
- 2019 Actual (pre-COVID): 12,160 (still far below the 2015 forecast of 17,000)
- 2024-2026 Actual: ~5400 (less than half of 2016 and 2019, and ~32% of 2015 forecast)
Douglas Tweet
Camas