Portland metro regional hours of delay predicted to triple
John Ley
for Clark County Today
After a decade or more of construction and the expenditure of at least $7.5 billion, and drivers have been paying tolls for well over a decade, traffic congestion on I-5 and I-205 will have gotten worse, according to Interstate Bridge Replacement Program (IBR) staff projections. The documents filed by the program indicate there will be a 31 percent increase in hours of traffic congestion.
Saving time and reducing traffic congestion is people’s number one priority. The IBR reported: “68 percent say that traffic congestion is their top priority.” Yet the various design options they are considering add no new through lanes to I-5 or the bridge to increase vehicle capacity. Presently there are up to 10.5 hours of traffic congestion a day.
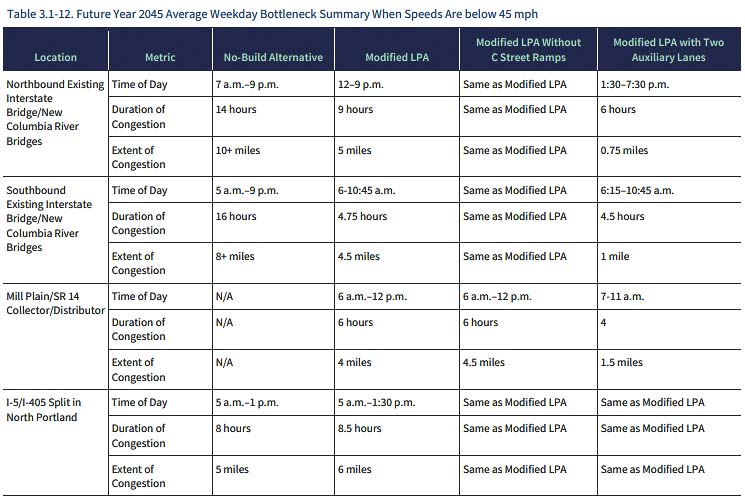
During a Draft Supplemental Environmental Impact Statement (DSEIS) public briefing on Oct. 9, a citizen asked how much traffic congestion there would be once the project was completed. Staff responded saying “between 10.5 hours a day and 13.75 hours”. The lower number is applicable to the two auxiliary lane option, whereas the Locally Preferred Alternative (LPA) that adds a single auxiliary lane has 13.75 hours of congestion.
The DSEIS has multiple options. They include a required “No-Build” option, the LPA which has a single auxiliary lane, plus another option to have two auxiliary lanes. “The addition of a second auxiliary lane would offer the highest level of improvement in reducing congestion, particularly for northbound travel,” according to the report.
This is of particular interest to Clark County residents as over 70,000 people earn a paycheck in Oregon. They are not only paying Oregon income taxes but they are also losing significant time stuck in traffic.
At best, people can expect things to stay the same on Interstate 5 Bridge travel times. The Portland metro area currently has the nation’s 8th worst traffic congestion. Regional travel times will get significantly worse by 2045, whether or not the replacement bridge is built or not.
Three years ago, Oregon Sen. Lew Frederick asked: “How much time will drivers save rather than just saying congestion will be addressed?” He referenced citizens’ dissatisfaction with the one minute improvement in the failed Columbia River Crossing effort. IBR Administrator Greg Johnson responded that “we can’t build our way out of traffic congestion.”
The DSEIS report indicates there is “19,400 vehicle hours delay” for the Portland Metropolitan Region. If they did nothing, saving $7.5 billion including not collecting tolls, the “No Build” alternative is estimated to have 65,500 vehicle hours delay. For the “traffic subarea” (I-5, I-205, and I-84) there are presently 10,100 hours of delay.
But following a decade or more of construction and people paying possibly $9.40 daily tolls, the project predicts traffic subarea delay of 17,400 vehicle hours for the single auxiliary lane option, and 17,000 vehicle hours delay for the two auxiliary lane option. The sales pitch for the project is smoother traffic flow. Yet the number of hours of delay will increase 70 percent.
The Portland metro area numbers are even more stark, nearly tripling current vehicle hours of traffic congestion.
Earlier briefings to legislators and various community groups showed morning (southbound) commute times from Salmon Creek in north Vancouver to the Fremont Bridge were expected to double from a current 29 minutes to 60 minutes or more in 2045. Furthermore, notes in the earlier report indicated fully half of rush hour traffic would be stuck traveling zero to 20 miles per hour.
Missing from the DSEIS are times for those same two points – Salmon Creek to the Fremont Bridge. Instead there is a reference to “I-5 Weekday Southbound AM Peak-Period Average Travel Times”. They report the No-Build alternative travel time at 58 minutes, the LPA at 54 minutes, and the two auxiliary lane option at 50 minutes. The reference to half of rush hour traffic traveling zero to 20 mph is missing.
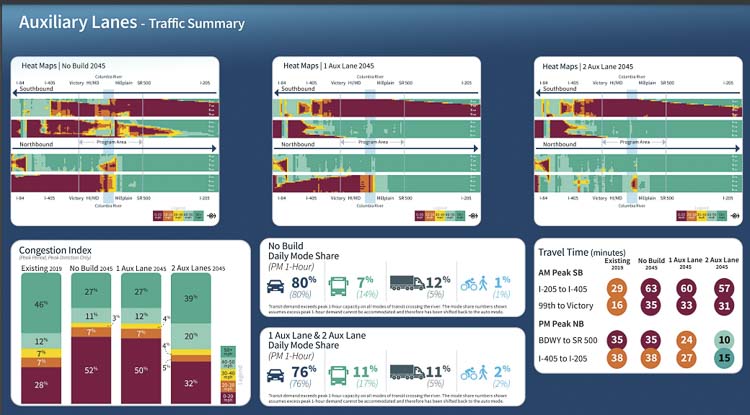
The project is allocating 54 percent of the surface area for bikes, pedestrians, and transit. Just 46 percent is allocated for cars and freight haulers. The report indicates an estimated 410 bicyclists and pedestrians, on average, make trips across the bridge daily. Transit would carry just 5.37 percent of daily trips, a miniscule increase of 0.11 percent from the No-Build alternative.
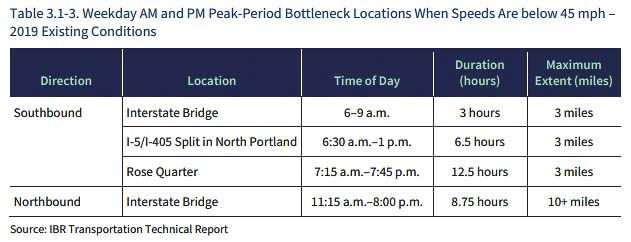
The DSEIS shows 2019 current conditions where there are three hours of congestion for southbound traffic and 8.75 hours of congestion for northbound traffic. The Rose Quarter interchange is congested 12.5 hours a day, demonstrating it is the real bottleneck in the region.
Freight haulers account for about 10 percent of the Interstate Bridge traffic. About 70 percent of truck trips using the bridge either start or end in the Portland-Vancouver metro area. Freight truck operators try to avoid the most congested periods of the day. The busiest interchanges for truck traffic are at Mill Plain Boulevard, City Center/SR 14, and Marine Drive, as they access the Port of Vancouver or the Port of Portland.
Data from Metro/RTC forecasts that by 2045, trucks will comprise almost 15 percent of total trips across the new Columbia River bridges, which is an increase of 50 percent compared to 2019. Freight hauler traffic will grow more quickly than general traffic they predict.
The report shows presently (2019) total vehicles crossing the Columbia River are 313,000. They expect that to increase to 400,000 in 2045 (No-Build option) and 389,000 in the single auxiliary lane Locally Preferred Alternative. They believe there will be 11,000 fewer vehicles crossing the river.
The report indicates more of the traffic growth over the river will occur on the I-205 Glenn Jackson Bridge (30 percent) versus the Interstate Bridge (26 percent).
People have the opportunity to make public comments on the DSEIS from now through Nov. 18. The entire series of documents can be viewed here, and comments can be made either by sending emails or entering them online.
Also read:
- Delays expected on Northwest 99th Street during water quality project construction
 Clark County will begin construction in July to install a stormwater filter vault on NW 99th Street. Drivers can expect delays, but lanes will remain open during the work.
 - POLL: What’s the biggest concern you have with the current I-5 Bridge replacement plan?As costs rise and Oregon’s funding fails, concerns mount over the current I-5 Bridge replacement plan. Clark County Today asks readers: what’s your biggest concern?
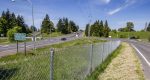
- Plan ahead for ramp closures on I-5 near Ridgefield, July 8-9
 Travelers on northbound I-5 near Ridgefield should prepare for ramp closures July 8–9 as WSDOT crews conduct final testing of new wrong-way driving detection systems. The closures affect exits 9 and 11, including the Gee Creek Rest Area.
 - Oregon DOT director calls transportation funding bill failure ‘shocking,’ warns of layoffsODOT Director Kris Strickler warned staff that up to 700 layoffs are imminent after lawmakers failed to pass a transportation funding bill, deepening the agency’s $300 million shortfall.
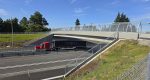
- New crossing opens over SR 500 in VancouverWSDOT has opened a new pedestrian and bike bridge over SR 500 in Vancouver, restoring direct and ADA-accessible access for people walking, biking, or rolling.