

Administrator Greg Johnson promises to be data driven on project
At the July 1 Community Advisory Group (CAG) meeting, Interstate Bridge Replacement Program (IBRP) Administrator Greg Johnson shared that the replacement bridge will have three through lanes. The process has previously revealed that citizens’ primary desire for a replacement bridge is a reduction in traffic congestion. How will three lanes reduce traffic congestion, especially when a replacement bridge will serve the Portland/Vancouver region for the next 100 years?
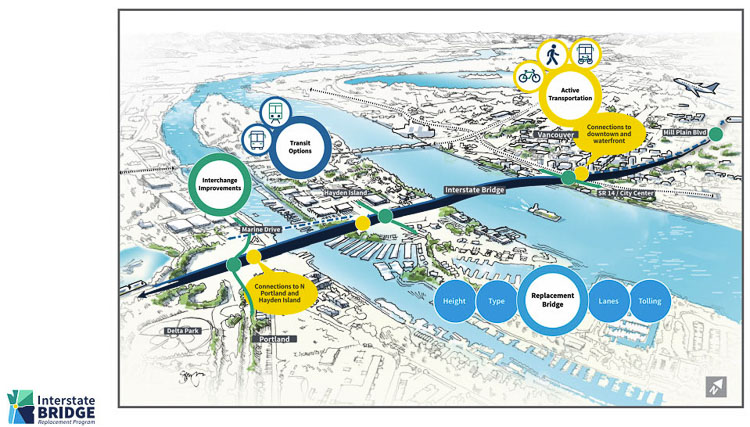
There is no bridge designed yet, but citizens want to learn the details on a multitude of issues. These are related to the height of the bridge for marine traffic, the type of transit being considered, the footprint of the bridge and specific location, what facilities will be included for bike and pedestrians, and more. But overwhelmingly, citizens value their time, and want a significant reduction in traffic congestion.
The CAG had a listening session in June. The feedback was that people wanted them to “plan for a 100-year bridge with future needs and adaptability so we aren’t here in 20 years.”
Multiple surveys indicate people are frustrated at the amount of time they lose being stuck in Portland’s congested traffic. In the past few years, the region has ranged from the eighth to the 12th worst traffic congestion in the nation. It’s been 40 years since a major new transportation corridor and new vehicle capacity has been added in the region. Clark County now has over 70,000 people who commute to Oregon for work, stuck in the traffic congestion.
Johnson recently spoke about four pressing questions the IBRP needs to answer. He offered his plan for the IBRP team’s plans in each of these areas, for the first time.
Those issues are:
• The possible replacement of the north Portland Harbor Bridge?
• Will there be an interchange on Hayden Island directly to I-5 or will it connect via an interchange at Marine Drive?
• How many through lanes will there be?
• What type of high capacity transit will be part of the project?
Johnson has promised to be “data driven” in all aspects of the project.
“We know there are three lanes to the north, three through lanes to the south,” he said. “So we pretty much know there’ll be three through lanes on this bridge. But the issue is how many auxiliary lanes to operate this bridge appropriately, to take some of those merge and weave movements and separate them from the through traffic.”
His team will look at those four questions and is gathering data. “We’re going to be doing some deep dives,” Johnson said. The IBRP team will be running models and hopefully have answers for all of those four questions early in 2022. He hopes to share that information in February or March next year.
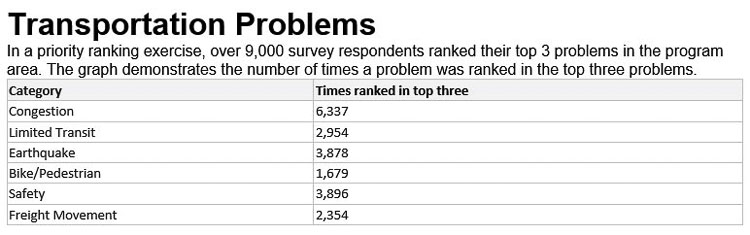
The people have repeatedly said reducing traffic congestion is their number one priority. In March, the IBRP released results of their online survey. In a priority ranking exercise, over 9,000 survey respondents ranked their top three problems in the program area. The graphic demonstrates the number of times a problem was ranked in the top three problems.
Reducing traffic congestion received 6,337 votes, roughly 62 percent more than safety and seismic concerns. Limited transit received about 53 percent fewer votes than traffic congestion, and was over 900 votes less than safety and seismic concerns.
A January 2019 Metro poll showed the number one priority was roads and highways. It reported 31 percent of citizens want “widening roads and highways” as their top priority. The Portland Tribune summarized: “On its own, improving public transit is a lower priority than making road improvements and the more overarching goal of easing traffic — voters still overwhelmingly rely on driving alone to get around,” reads the poll’s conclusions.
The IBRP team hired FM3 in November and December 2020 to take a formal survey of attitudes and desires of metro area citizens regarding the program.
Traffic congestion topped voters’ concerns, with 68 percent saying it is very or extremely concerning. A major earthquake was second with 51 percent very or extremely concerned. The survey canvassed 917 registered voters in Clark, Clackamas, Multnomah and Washington counties. According to IBRP staff, they over-sampled people of color and Clark County citizens.
Transportation architect Kevin Peterson scrutinized all the traffic projection data in the former Columbia River Crossing (CRC) project. He shared the data indicating the I-5 transportation corridor would need five through lanes in each direction by 2030 and eight lanes by 2060.
Has the IBRP team commissioned a new traffic projection evaluation, in order to believe 3 lanes are appropriate for a new bridge expected to last for the next 100 years? Recently ODOT’s Kris Strickler told a Vancouver citizen he didn’t expect to conduct an O&D (origination and destination) survey of traffic patterns.
Where will the IBRP team get current data? Peterson indicated the CRC traffic data came from Washington DOT studies conducted in the early to mid 2000’s.
Metro predicts regional population will grow by 1.1 million people, from 2.4 million in 2015 to 3.5 million people in 2060. An Oregon State University projection indicates there will be an additional 3.05 million people by 2100 in the Willamette Valley, with the largest majority of growth in the three-county Portland metro area.
The CRC failed for many reasons, including delivering only a one minute improvement in the morning southbound commute. Given that reducing traffic congestion (and travel times) is the people’s top priority, how much time will a three-through lane IBRP bridge save?
Citizens will weigh in on their top priority and decide if there is appropriate value in this project. The IBRP team reported last fall that “if” the former CRC bridge were built today, it would cost between $3.2 billion and $4.8 billion.
Johnson promised his staff would be doing “the tough engineering, the modeling, to look at our traffic numbers to look at the impacts that all of these things will have on the overall community. We’ll be looking at these things in depth over the next six to eight months.”
He indicates he has received approval from the various partners to move forward. He and his team don’t believe funding issues for the project will be critical until the 2023 to 2024 time frame. Tolls will be a part of the project, Johnson said.
CAG member Martha Wiley asked for a “cradle to grave” analysis between light rail and BRT (bus rapid transit), “including manufacturing the vehicles, the power usage, the environmental impacts of that power usage, and just a whole range of details.”
Bill Prows asked about the demands by politicians, especially Oregon’s Peter DeFazio and Earl Blumenauer, who have said light rail must be part of the bridge project.
Johnson responded that his team is bound by the National Environmental Policy Act (NEPA), the process to get federal dollars on projects like this. “We have to do the hard work of going through the data, running the models, and being transparent enough that folks will see that we are doing the right thing,” he said.
“We have to have the numbers (data) to back us up,” Johnson said. “We tell elected officials that we have to live by the numbers.” He closed with “we’re professionals, we’ll run the numbers, and the numbers will guide us.”
Tom Gentry asked about the news reports about the TriMet debt issue. Johnson indicated the debt issues are not something the IBRP team will be involved in negotiating between the two transit agencies. His focus is funding the capital costs of some form of transit, either BRT or light rail. The debt “is not the concern of the program,” he said.
Johnson shared that the team is being more aggressive with the media. “We want to be sure we are defining the program rather than having others define it.”
The IBRP team provided examples of responding to community input and feedback. The inclusion of climate change and equity issues into the Purpose and Need statement were given as an example.
The detail most citizens want to know, how many through lanes, has apparently been decided. It will be next spring before the IBRP team provides its data and details related to the type of transit, the bridge height, and whether or not there are exits/entrances directly to Hayden Island, and more.
The IBRP was asked “how will three through lanes in each direction reduce traffic congestion?” Furthermore, “what is the data that supports the IBRP team choosing to put 3 through lanes on the replacement bridge, given that this “asset” is expected to serve the Portland/Vancouver region and all of Oregon and Washington, for the next 100 years?”
We have not yet received a response.
The Executive Steering Group which provides oversight for the program will meet Thu., July 15 from 10 a.m.-noon.
