How many cases showed symptoms, and which ages and races are being hit the hardest?
CLARK COUNTY — Whether you fear the virus, or feel it has been overblown, one thing is becoming abundantly clear: COVID-19 is on the rise again in Clark County and across most of Washington state.

On Wednesday, Clark County Public Health (CCPH) announced 62 newly confirmed cases, bringing the pandemic total to 4,666, with an average of 51 new cases per day since Friday.
The death toll has remained at 69 since Monday when three deaths were reported.
Hospitalizations are also increasing, with 26 confirmed and 12 suspected cases in Clark County hospitals. That accounts for 6.1 of overall bed space, still within the 10 percent metric set by the state.
As of today, the county says there are 183 active cases, meaning people who have yet to complete a 10-day isolation period since symptom onset, or a positive test.
The rate of new cases per 100,000 residents climbed yet again this week, from just over 115 to nearly 124, the highest since the county began tracking that metric in mid-July.
Who has symptoms?
One frequent question has centered on how many of the people in Clark County who’ve tested positive for COVID-19 actually felt sick.
According to data released by CCPH, 75 percent of the 1,165 confirmed cases since the start of this month said they were experiencing some symptoms of COVID-19, which can include fever, shortness of breath, dry cough, lack of smell and/or taste, and fatigue.
Only 10 percent of cases said they had no symptoms at the time they were interviewed, though the county noted they generally would not know if someone later developed symptoms.
Numbers were similar across all cases between March 16 and Oct. 26, with 11 percent saying they had no symptoms during their interview, 73 percent experiencing symptoms, and two percent having symptoms that could potentially be from something other than COVID-19, while 15 percent of cases had no data.
The data does not keep track of symptom severity, or how many of those cases had to spend time in the hospital.
Demographic breakdown
Clark County Public Health has also released more detailed demographic data for COVID-19, comparing the rate of cases to population metrics.
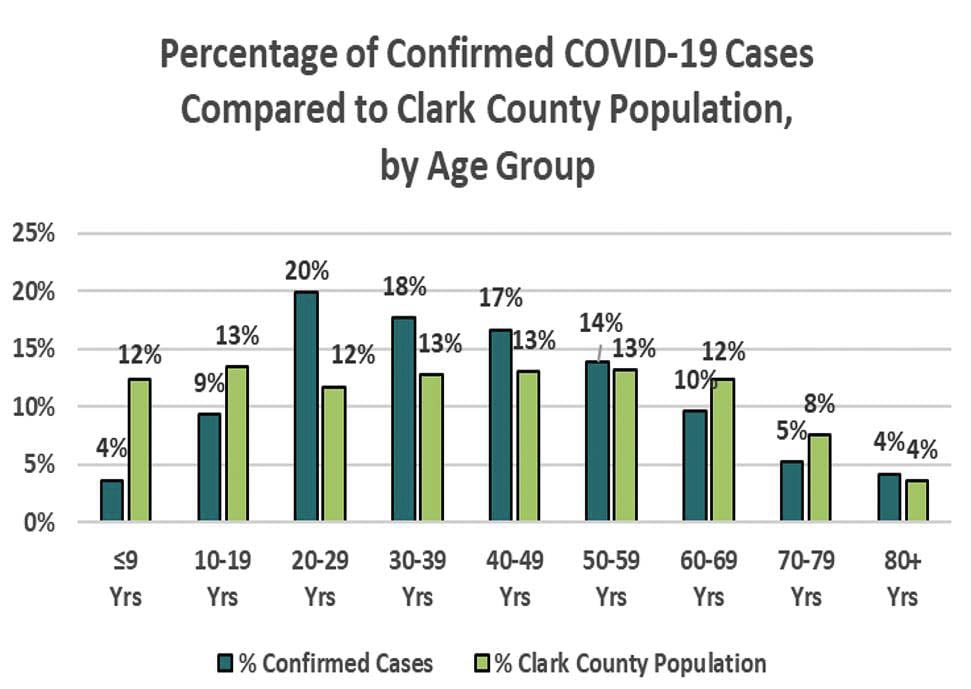
For instance, while people between 20-29 account for 12 percent of the county’s overall population, they make up 20 percent of total COVID-19 cases.

That means for every 100,000 residents between the ages of 20-29, there have been 1,578 cases.
Overall, 55 percent of COVID-19 cases have been in people 20-49 years of age, while that demographic makes up 38 percent of the county’s overall population.
While, overall, numbers for people 80 years and up are low, at just 192 total cases, that still equals a rate of 1,089 cases per 100,000 people in that age bracket, which makes up four percent of the county’s overall population.
Thirty-eight of the 69 deaths have been in people over 80, meaning the mortality rate for that age bracket is over 20 percent, assuming every case has been diagnosed.

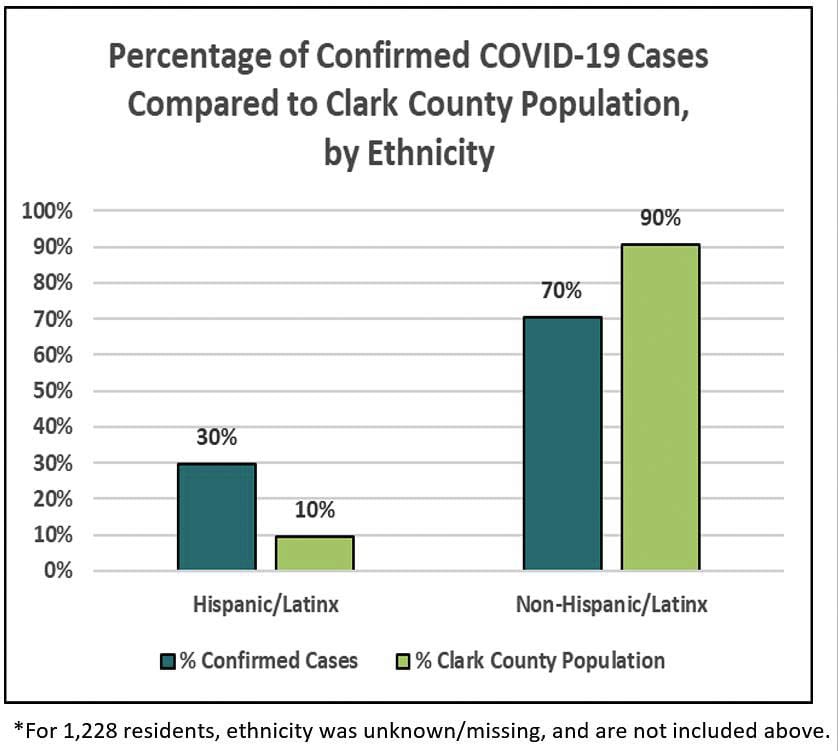
In terms of race, the area’s LatinX population has been hit hardest by the pandemic.
According to CCPH data, 30 percent of cases identified as Hispanic or Latino, while that ethnicity accounts for 10 percent of the overall population.
Among other races, two percent of cases were native Hawaiian or Pacific Islander, compared to one percent of the population.

Only Asian and Caucasian ethnicities had seen fewer cases relative to their percentage of the population, according to the county, which notes that data on race was missing in 1,637 cases.
Rate of new cases continues to climb
While deaths from COVID-19 have not returned to levels seen earlier in the pandemic, the rate of new cases is clearly climbing statewide, and health officials say increased testing cannot account for all of the increase.
“It’s been a topic in social media that we’re seeing more cases because there’s more testing done,” said Dr. Alan Melnick, the county’s public health officer and health department director at a Board of Public Health meeting on Wednesday. “The number of cases is rising out of proportion to the number of tests that are being done, so we are actually seeing more cases. And this is including all age groups, and crossing across all geographic areas in the western part of the state, which suggests that there’s nothing really specific that’s driving this other than we’re seeing generalized community transmission.”
Melnick added that, unlike the spike of cases last July, the current increase can’t be tied to a handful of larger outbreaks.
According to the latest Washington situation report, released on Oct. 26, the effective reproductive rate of COVID-19 has returned to early summer levels for the western half of the state.
The reproductive rate is a measure of how many people a single case might infect. Any number above one means the rate of infection is growing, perhaps exponentially.
Through Oct. 15, that rate was estimated to be at 1.34 in western Washington, and 1.12 in eastern Washington. Both sides of the state had been below one for much of July and August.
A 7-day moving average of cases shows Clark County among the state’s hot spots, with 45 new cases per day on average through Oct. 15, equaling the rate set in early July.
Clark County does not track total tests, and the state has not released updated data since late September, so it’s difficult to know how many tests are being done overall compared to earlier in the pandemic.
Clark County Today is working to better understand the most recent trends, which have seen cases rise while deaths from COVID-19 remain relatively flat. Stay tuned for more coverage of this topic soon.


